Business Process Modeling: What a BPM Is, How to Create a BPM, Benefits and Examples of a Business Process Model
Business process modeling (BPM) is a technique for designing, analyzing, and improving business processes. It can be used to document existing processes or design new ones. BPM involves understanding how a company's resources are used to complete work tasks. This understanding can be used to redesign processes to make them more efficient and effective.
BPM tools can be used to create process models. These models can be used to simulate processes to identify bottlenecks and inefficiencies. They can also be used to create process documentation. Process models can be created using different notation systems, such as the Business Process Modeling Notation (BPMN) or Unified Modeling Language (UML). There is also an advanced version of BPMN, simply known as BPMN 2.0.
BPM is a key component of business process management (BPM) initiatives. BPM initiatives seek to improve the efficiency and effectiveness of an organization's business processes. BPM can be used to assess, redesign, and implement business processes.
How to Create a Business Process Model
Business process modeling diagrams are made using a variety of tools and techniques. The most common tool is the business process modeling software, which allows users to create and edit diagrams using a graphical interface. Other tools used for making business process modeling diagrams include flowcharting software and word processing software.
Some of my favorite BPM tools are Mural, Miro, and Lucidchart.
When creating a business process modeling diagram, the first step is to identify the business process that needs to be modeled. This can be done by analyzing existing business processes or by conducting interviews with employees who are familiar with the process. Once the business process has been identified, it is important to understand the different steps involved in the process. This information can be gathered through interviews, observation, or by reviewing documentation.
Once the business process has been understood, it is time to start modeling it using a software tool. There are many different software tools available for this purpose, but the most popular ones are business process modeling software and flowcharting software. These tools allow users to create diagrams that represent the different steps in a business process.
After the business process modeling diagram has been created, it is important to test it to ensure that it accurately models the business process. This can be done by running simulations or by actually implementing the diagram in a real-world environment. Once the diagram has been validated, it can be used to improve existing business processes or to create new ones.
Symbols Used In a Business Process Model
Oval
An oval shaped object in a BPM represents the beginning and endpoints of a process. Depending on the complexity of the process, you could have multiple beginning and endpoints, but at the very least, you need to have at least one starting point and one endpoint.
Rectangles
Rectangles are one of the most commonly used shapes in business process modeling diagrams. They represent activities, which are the basic steps or actions that make up a process.
Rectangles are usually connected to other shapes by arrows, which show the order in which the activities take place. Activities can be connected to multiple other activities, depending on the complexity of the process.
Rectangles can also be connected to other objects in a business process model, such as documents, data, or even other people. This shows that these objects are involved in the activity in some way.
Diamonds
When used in business process modeling, a diamond generally represents a gateway, or also referred to as a decision point. This means that the process flow will branch out depending on the outcome of the decision. For example, if a customer decides to purchase a product, the process flow will take them through the steps of adding the item to their cart and checking out. However, if the customer decides not to purchase the product, the process flow will branch off in a different direction. In this way, diamonds are used to model different possible paths that a process can take.
Arrows
An arrow in a business process modeling diagram typically represents a flow of information, data, or material. The direction of the arrow indicates the direction of the flow. In some cases, an arrow may represent a directed step in a process, such as when it is used to show the sequence of steps in a workflow. Arrows are also commonly used to show relationships between different elements in a diagram, such as when one process is a sub-process of another. In general, arrows can be used to show any kind of connection or relationship between elements in a diagram.
When creating a business process model, it is important to choose the right type of arrow to represent the intended meaning. For example, if an arrow is meant to show a flow of information, data, or material, then it should be drawn as a solid line. If an arrow is meant to show a directed step in a process, then it should be drawn as a dashed line. And if an arrow is meant to show a relationship between different elements in a diagram, then it should be drawn as a dotted line.
When using arrows to show flows, it is also important to label them with the name of the flow. For example, if an arrow is meant to show the flow of data from one process to another, then it should be labeled “Data Flow”. This will help to make the diagram more understandable and easier to interpret.
When using arrows to show relationships between different elements in a diagram, it is helpful to use different colors to represent different kinds of relationships. For example, red arrows could be used to show processes that are sub-processes of another process, while green arrows could be used to show processes that are parallel to each other. By using different colors, it will be easier to see the relationships between the different elements in the diagram.
In general, arrows are a very powerful tool for showing the relationships between different elements in a business process model. By using them correctly, they can make the diagram more understandable and easier to interpret.
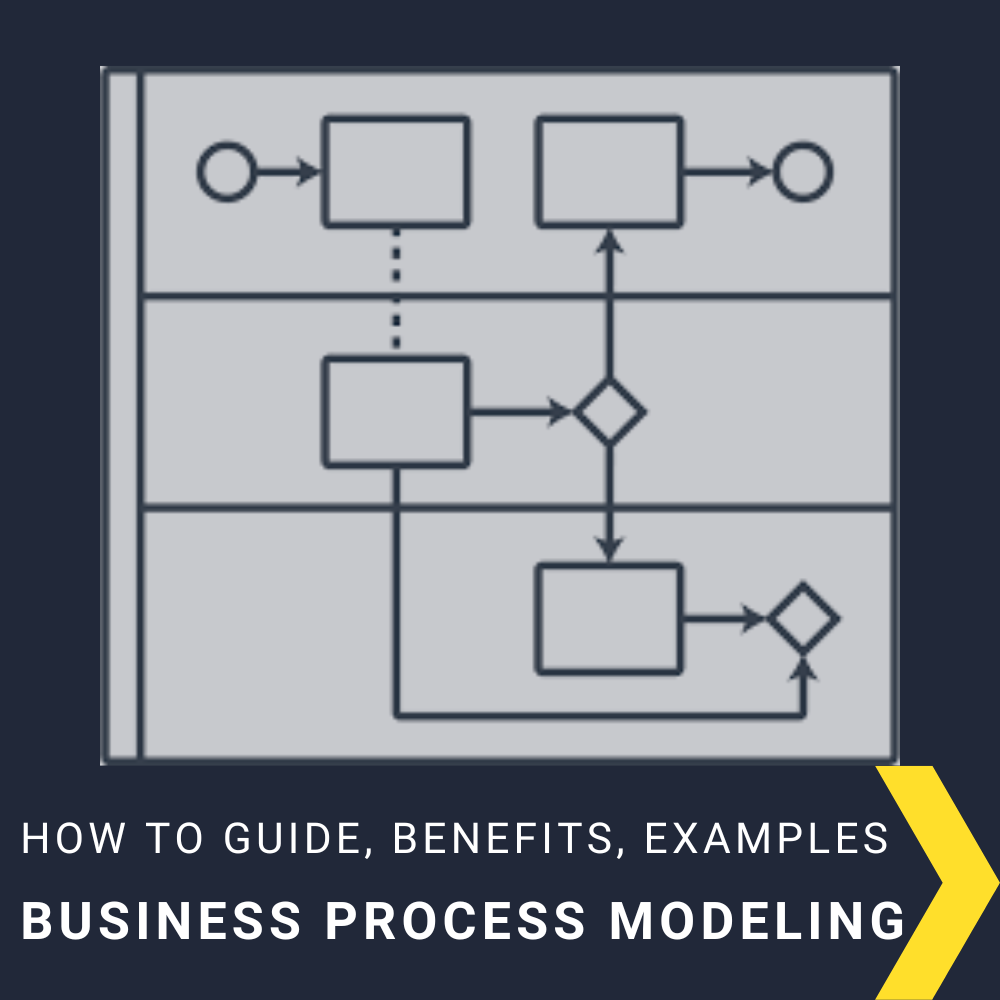
Swimlanes and Pools
Swimlanes and pools are used in business process modeling diagrams to visually separate out different parts of a process. This can help to make the diagram more understandable and easier to follow. Swimlanes can be used to show different departments or roles within a process, for example. Pools can be used to show different stages of a process, different sub-processes within a main process, or even separate entities if the process involves outside vendors or partners.
Both swimlanes and pools can be labeled with text to further clarify their purpose. In some diagrams, different colors may be used for different swimlanes or pools. This can also help to make the diagram more understandable and easier to follow.
When using swimlanes and pools in a business process modeling diagram, it is important to make sure that the diagram is clear and easy to understand. Otherwise, it may be confusing for people who are trying to use the diagram to model a process.
If you are not sure how to use swimlanes and pools in a business process modeling diagram, there are many resources available online that can help you. There are also software programs that can help you create and edit business process modeling diagrams.
Outputs of a Business Process Modeling Exercise
Event Logs
Event logs serve as a valuable tool in business process modeling. By tracking events that occur during a process, analysts can better understand the flow of work and identify potential issues. Event logs can be used to monitor performance, optimize processes, and troubleshoot problems. In addition, event logs can help organizations meet compliance requirements by providing a record of activities that can be audited.
When creating a business process model, analysts should consider the types of event logs that would be most useful for their purposes. Event logs can be generated manually or automatically, and they can be stored in a central repository or distributed across multiple systems. There are many different software applications that can be used to create and manage event logs. Some of these applications are designed specifically for business process modeling, while others are more general-purpose tools.
When choosing an event log management solution, analysts should consider the features that are most important for their needs. Some solutions offer real-time monitoring and alerts, while others provide historical data analysis capabilities. Some solutions are better suited for small businesses, while others are designed for enterprise-level organizations.
No matter what type of event log management solution is used, analysts should make sure that it integrates with the other tools and systems that are used in their business process models. This will ensure that data from the event logs can be seamlessly integrated into the overall model.
Event logs are a valuable tool for business process modeling, and they can help organizations improve the efficiency of their workflows. By choosing the right event log management solution, analysts can make sure that they are able to get the most out of this powerful tool.
Process Mining
Process mining is a branch of data mining that deals with discovering, monitoring and improving business processes. It can be used to model and improve all sorts of processes, including manufacturing, logistics, service delivery and healthcare.
Process mining uses data from event logs to create models that can be used to understand, monitor and improve processes. These models can be used to answer questions such as:
What is the average time it takes to complete a task?
How often do errors occur, and what are their causes?
What is the most efficient way to perform a task?
Process mining can also be used to detect process deviations and help businesses diagnose and fix problems. For example, if a process is taking longer than it should, process mining can be used to identify the causes of the delay.
What Business Process Modeling Can Show Us
Control Flow
Control flow is a fundamental concept in business process modeling. It refers to the order in which activities are performed in a process. In other words, it's the sequence of steps that need to be followed in order to complete a task or achieve a goal.
There are four main elements of control flow: sequence, branching, iteration, and concurrency.
Sequence is the most basic form of control flow. It simply means that activities are performed in a linear, step-by-step fashion. Branching occurs when there is a decision point in a process, and different paths can be taken based on the outcome of that decision. Iteration happens when an activity is repeated multiple times, until a certain condition is met. And finally, concurrency refers to the simultaneous execution of two or more activities.
Control flow is an important part of business process modeling because it helps to optimize processes and make them more efficient. By understanding the different elements of control flow, businesses can identify opportunities for improvement and make changes that will save time and resources.
When designing a new process, it's important to consider the control flow carefully. The wrong choice of sequence, for example, can lead to inefficiencies and bottlenecks. On the other hand, too much concurrency can make a process difficult to manage. The goal is to strike the right balance between different elements of control flow, in order to create a process that is both effective and efficient.
Data Flows
In business process modeling, data flow is the process of moving data from one place to another. It is a key concept in understanding how businesses operate and how information flows between different parts of a company. Data flow diagrams (DFDs) are often used to visualize data flow and show how data is processed within a system.
DFDs show the direction of data flow, as well as the transformation of data from one form to another. Data flow diagrams can be used to model any type of system, from a simple process to a complex computer system.
Performance Metrics
Performance metrics are key indicators of success in business process modeling. By tracking and analyzing these metrics, businesses can identify areas of improvement and work to optimize their processes. Common performance metrics include cycle time, throughput, yield, processing time, and scrap rate.
Cycle time is the total time it takes to complete a process from start to finish. This metric is important for understanding how efficient a process is and can help identify areas of bottlenecks or inefficiencies.
Throughput is the rate at which a process can produce output. This metric can be used to assess the capacity of a process and identify potential areas of improvement.
Yield is a measure of the quality of output from a process. This metric can be used to assess the effectiveness of a process and identify potential areas for improvement.
Scrap rate is the percentage of output from a process that is considered waste or unusable. This metric can be used to assess the efficiency of a process and identify potential areas for improvement.
Performance metrics are important tools for businesses to use in order to assess and improve their business process models. By tracking and analyzing these metrics, businesses can identify areas of improvement and work to optimize their processes.
Resource Utilization
Resource utilization is a key element of business process modeling. It allows businesses to understand how their resources are being used and identify areas where improvements can be made. By understanding resource utilization, businesses can optimize their processes and improve their overall efficiency.
There are a number of different ways to measure resource utilization. The most common method is to track the amount of time that each resource is used. This information can be used to identify which resources are being used most efficiently and which ones are not.
Another way to measure resource utilization is to track the number of resources that are required for each task. This information can be used to determine how many resources are needed for a particular task and whether or not there are any unnecessary resources being used.
Once businesses have a good understanding of resource utilization, they can begin to make improvements to their processes. By making changes to the way resources are used, businesses can improve their overall efficiency and save money.
Resource utilization is an important part of business process modeling. By understanding how resources are being used, businesses can optimize their processes and improve their overall efficiency.
Benefits of Business Process Modeling
While there are many different benefits to doing business process modeling, I want to highlight three of the biggest ones in my opinion.
Provides a quantitative data driven view of how work gets done
Makes it possible to simulate change
Creates a common language around processes that is visual and data driven
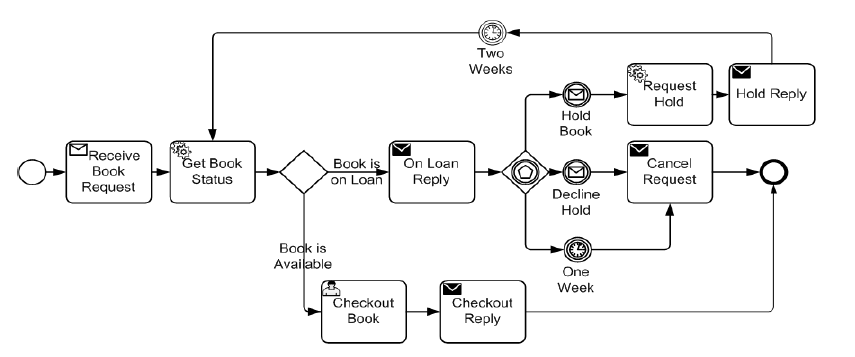
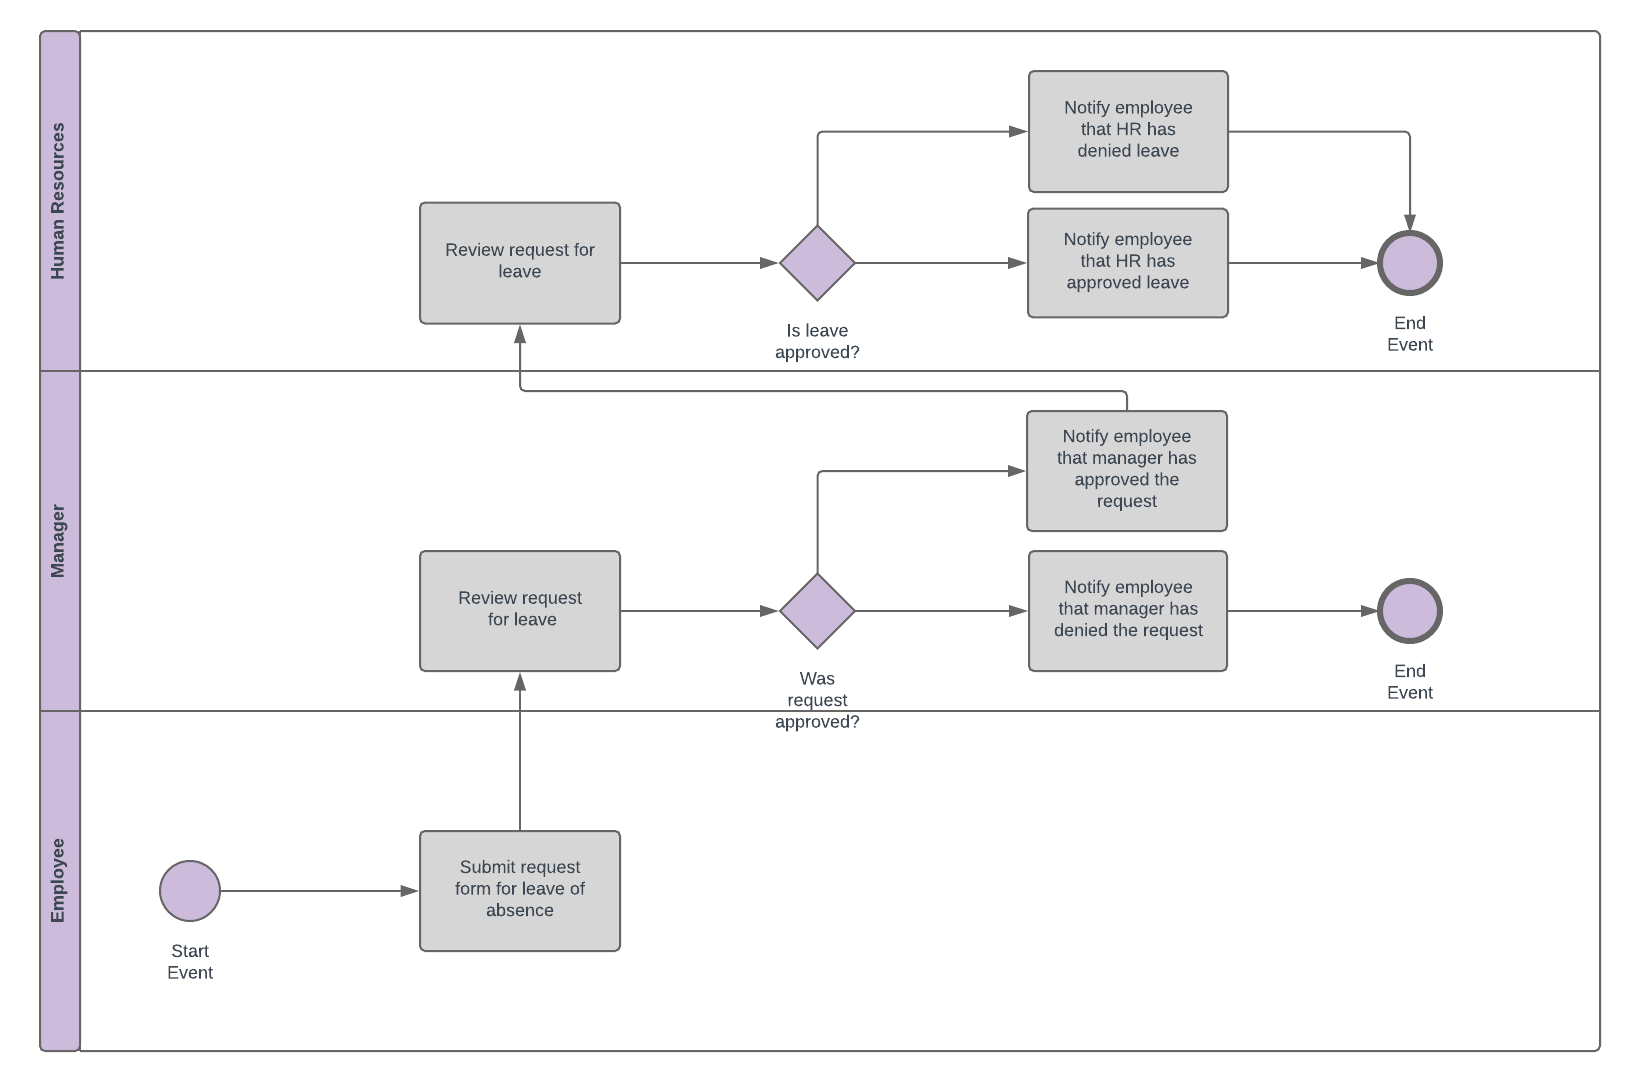
Examples of Business Process Model Diagrams
Below are some examples of Business Process Models