The Complete Guide to Six Sigma SIPOC Diagrams
Summary: In the “Define” stage of the DMAIC improvement cycle, a common exercise for Six Sigma team members is to develop a SIPOC diagram, which provides an easy, visual way to see all of the inputs and outputs of a process. SIPOC diagrams give that high-level view, usually created in the beginning of a new Six Sigma project. In this article, I will walk through what a SIPOC Diagram is, how to create and fill in a SIPOC Diagram by using a very simple example, and finish up by recommending some templates and tools you can use to get started with building a SIPOC Diagram.
If you are ready to get started with your SIPOC chart right now, I have a free SIPOC diagram template, formatted for both Google Sheets and Microsoft Excel that you can grab right now. Otherwise, keep reading for more information about SIPOC diagrams, the process steps for creating a SIPOC Diagram, a few SIPOC diagram examples, and my recommendations of tools and templates.
What is a SIPOC Diagram?
A SIPOC Diagram is a visual tool for showing key elements of business processes from beginning to end. The SIPOC Diagram is essentially a high-level process map that is useful at the beginning of a project where an overview is necessary to not only understand the critical dimensions of a process but also to contemplate and analyze how they contribute to the organizational goals and objectives. It is therefore considered an important part of the “Define” phase in DMAIC.
The SIPOC design is positioned early in a process improvement project because while efficiency and quality of a process is ultimately what is going to be worked on, it is necessary to understand as much as possible about the process itself before addressing the details of efficiency and quality. The SIPOC Diagram covers off on this need.
It is easy to build a SIPOC Diagram yourself, but there are plenty of SIPOC Diagram templates out there. Whether you want to create your SIPOC Diagram in a spreadsheet program like Google Sheets or Microsoft Excel, or in a visual design tool like Microsoft Visio or Miro, there is a SIPOC diagram template out there for you.
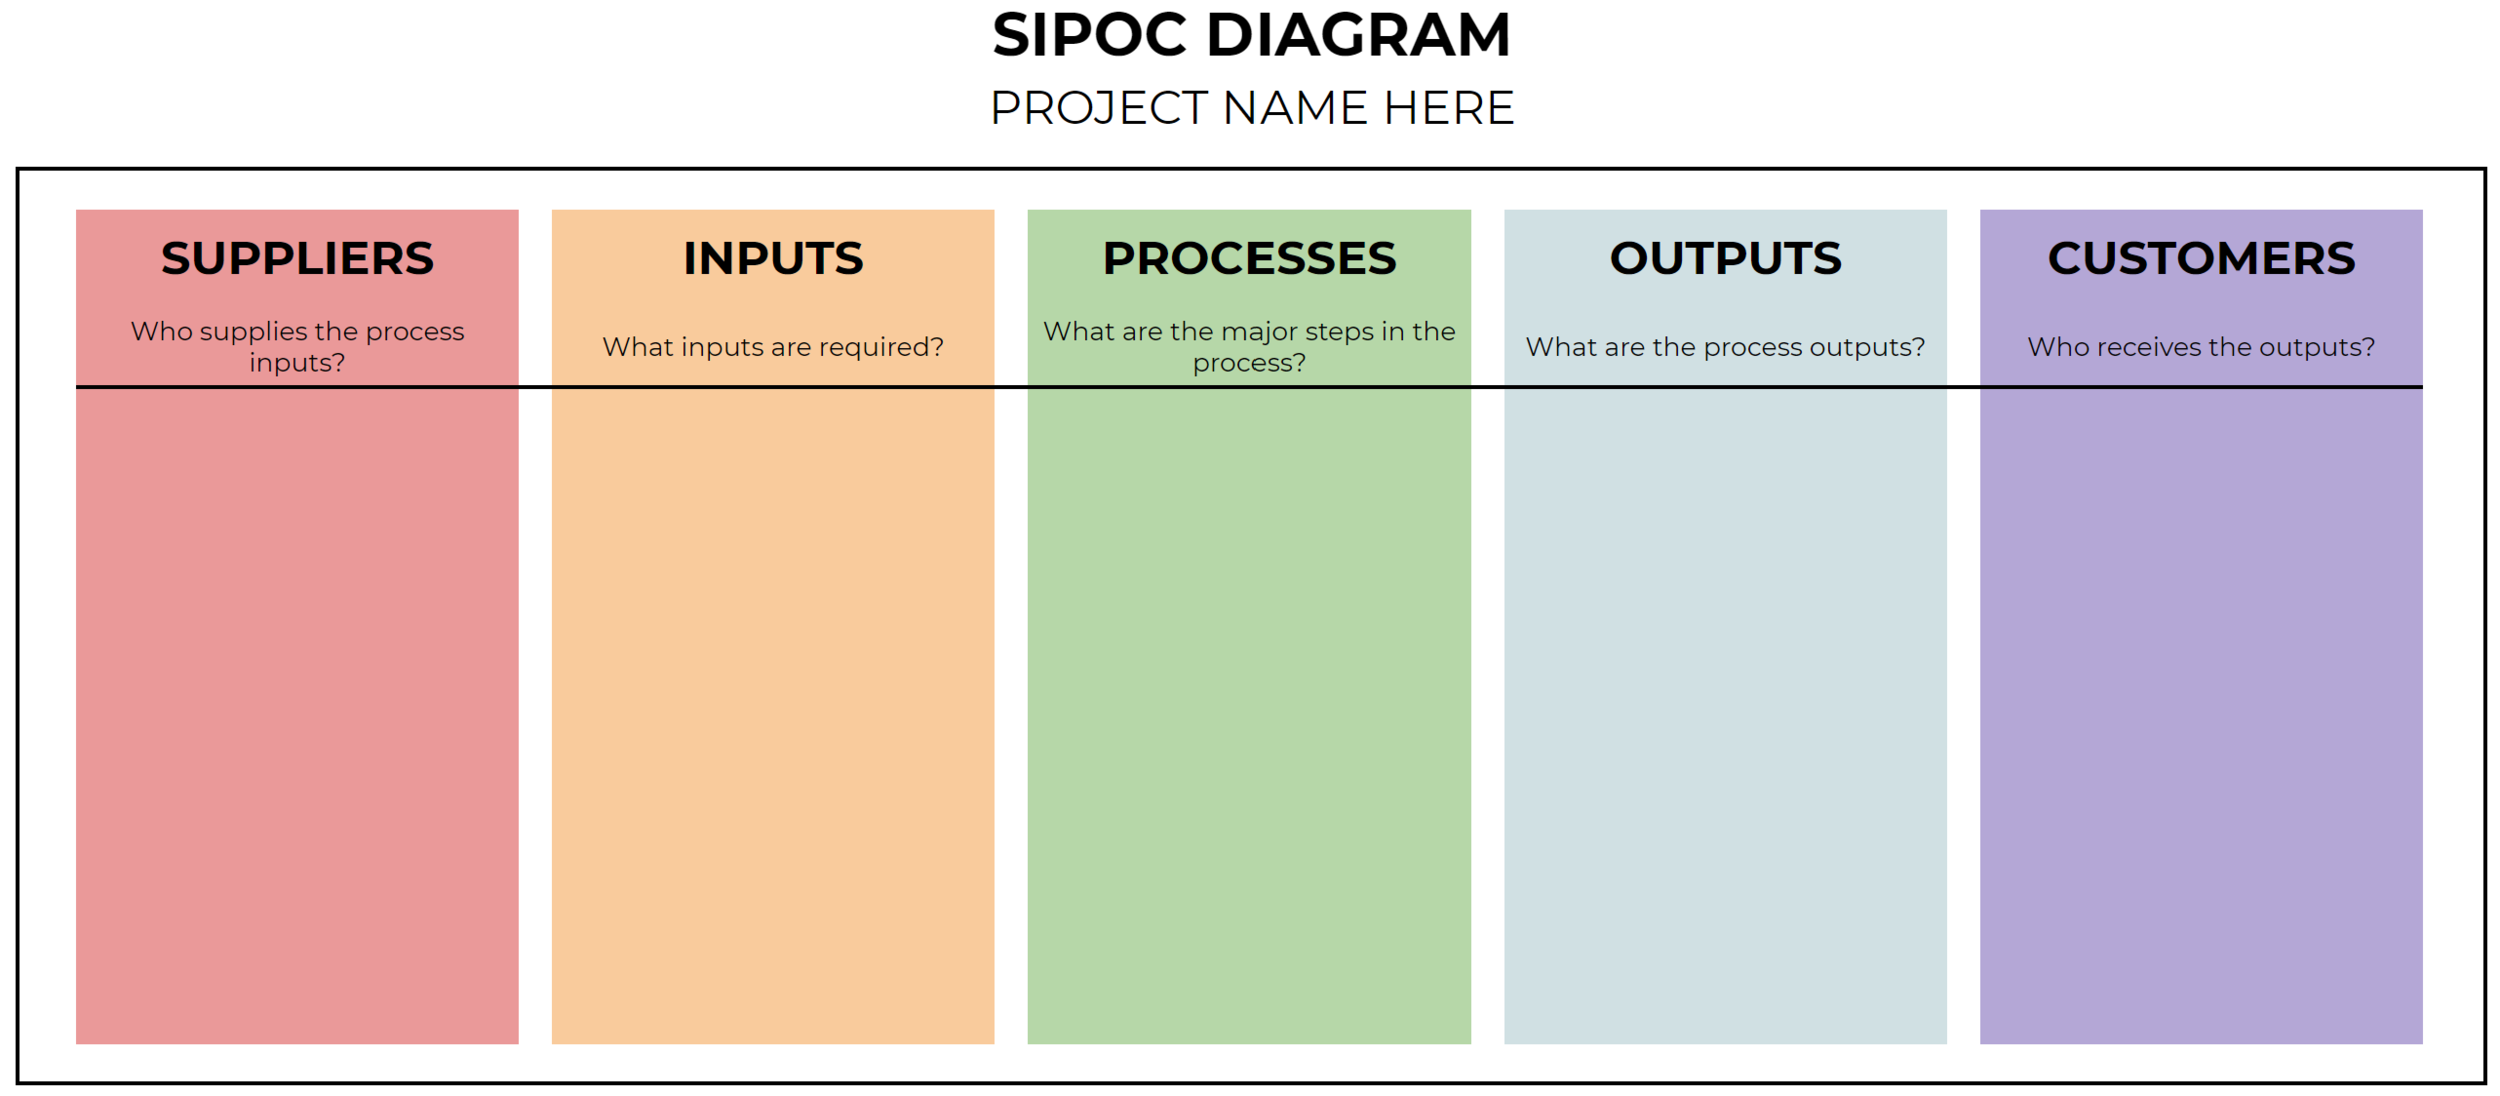
The five components of the SIPOC Diagram
A SIPOC Diagram identifies suppliers, inputs, process, outputs, and customers that are all a part of your process. In general, you read the diagram from left-to-right, as that provides a good description of how the project flows. Each section of the SIPOC asks a question for you to complete that section. When done thoroughly, this provides clarity of who is all involved in the project, what the inputs and outputs are, and what processes will be performed. This is described below.
Suppliers to Inputs to Processes to Outputs to Customers

The SIPOC Diagram adds clarity to a process
The SIPOC Diagram is particularly useful when it is not clear:
Who are the suppliers of the inputs?
What inputs are required?
What are the major steps in the process?
What are the process outputs?
Who receives the process outputs?
Again, the emphasis is on making sure that at the beginning of a marketing project nothing has been overlooked. This is why the SIPOC Diagram is a great starting point for a process improvement project. By having a visual diagram of your complete process from beginning to end, you can easily see any holes in your process and completely fill out the complete process before you begin your improvement project.
How to Create a SIPOC Diagram
After you have your five columns titled with “Suppliers”, “Inputs”, “Processes”, “Outputs”, and “Customers”, it is time to start filling it in. If you need a SIPOC Diagram template, I offer a free template to help get you started. There are two different ways I recommend doing this, depending on your situation. Let’s break down the two ways to complete the SIPOC Diagram.
Option 1: If You Are Diagraming an Existing Process You Want to Improve
If you have an existing process that is currently up for possibly being part of a process improvement project, I recommend your first step is to start building out your SIPOC Diagram by starting in the middle. In the Process column, write down the main, high-level processes that occur. Best practice is to only document 5-7 processes. Ideal is five, but anything more than seven is too detailed for a SIPOC Diagram. After you complete the “Process” section, work your way out from the center. I personally would start by going left, completing the “Inputs” column next, then completing “Outputs”. The go back to the left side and complete “Suppliers”, followed by “Customers”. I have no issue if you want to hammer out the left side of the Diagram completely (both “Inputs” and “Suppliers”) before doing the right side. That is up to you. The main takeaway is that if you should have a continuous improvement process and are taking the time to examine existing processes and starting in the middle of the diagram is very effective.
Option 2: If You Are Planning New Products or Services and Want to Start with a SIPOC Diagram
If you are using a SIPOC Diagram to plan out a new product or service, I recommend starting from the right side of the model by completing the “Customers” column first. This helps frame up the customer needs and customer requirements that you want to deliver value to meet. Knowing your customer will help you work backwards to create the best product or service. After you define your customer, the key steps continue with moving one column to the left to complete the “Outputs” column. You have spent the time defining the customer, so naturally writing out the outputs of the process you are going to deliver to the customer and in what form is a great exercise. Then complete “Process” to document how those outputs are created. Then fill out the “Inputs”, followed by “Suppliers”. This is a “start with the end in mind” method for completing the SIPOC Diagram, which is very effective.
How the SIPOC Diagram helps in Marketing
In my opinion, one of the departments within a company that has the most processes is marketing. From campaign planning and execution to creative design and development, there are so many functions within marketing that require a followed process. Where marketers often miss the mark is clearly defining these existing processes, any new process opportunities, and reviewing processes to find waste and improvement opportunities. Creating a SIPOC Diagram is a great starting point.
Below is a very high-level example, with not too much detail, of a common marketing project that consists of all elements of a SIPOC Diagram. In the simple example, the process being documented is the design, development, and deployment of a campaign landing page.
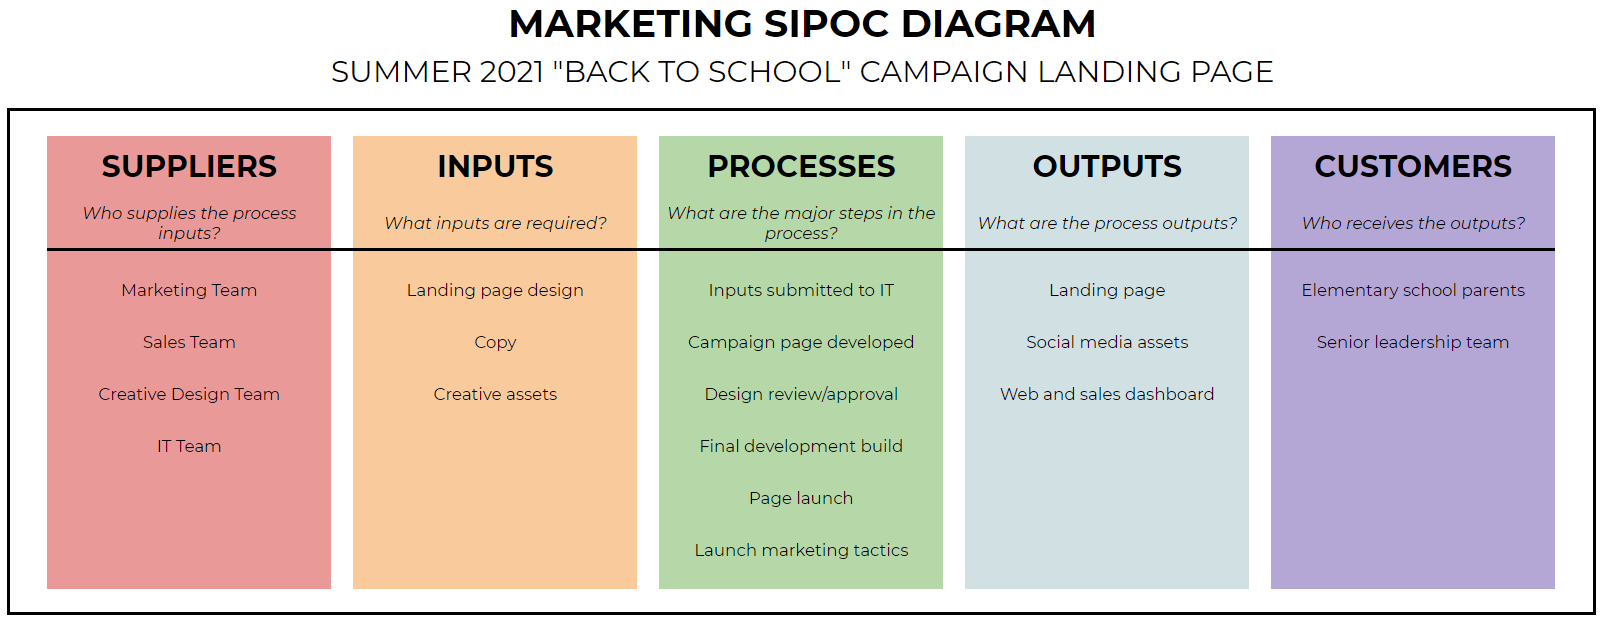
Working from left-to-right, this SIPOC diagram example starts by looking at the process’s suppliers. In this example, several teams are involved in supplying information or assets for the campaign landing page. Next, the inputs are defined. In this example, things like creative assets and web copy are listed. Next are the major steps that take place in this particular process. For a marketing campaign landing page, this would include processes around design of a webpage, development, and testing, just to name a few. After the processes are completed, there are outputs. In this SIPOC example, you can see that the landing page and maybe some reporting tools, like a dashboard, would be your outputs. Finally, the SIPOC Diagram displays the end customers who receive the outputs of the process, in this case school parents use the campaign’s landing page and your leadership team receives the reports.
Now that you have the SIPOC Diagram completed, you can move forward with your process improvement project knowing who all, and what all, touches this process. Because the SIPOC Diagram is very simple and straight-forward, anyone within your organization can understand it.
The SIPOC Diagram is just the starting point
A SIPOC Diagram identifies the key entities in every step of the process, and is a great element to include in your business process management practice, but that is just the starting point. Now that you have a visual of the overall process, your next step is to build the value stream and process maps to illustrate the sequence and relationship of steps in converting inputs to outputs. You will build these tools as you move through the DMAIC framework in a Six Sigma methodology.
Whether you are kicking off a process improvement project within your marketing department or not, I recommend having a SIPOC Diagram created for all the major marketing processes. They help provide reference for other departments, or your leadership team, when needed.
Templates and Tools for Creating SIPOC Diagrams
Need help building out a SIPOC Diagram? I am here to help. There are two main ways I can provide some expert assistance in helping you create a SIPOC Diagram that meets your needs and can help you build, improve, or understand your processes.
SIPOC Diagram Templates for Google Sheets, Microsoft Excel, and Microsoft Visio
This is a screenshot of my SIPOC template for Google Sheets and Microsoft Excel.
First, I do offer a free SIPOC template in both Google Sheets and Microsoft Excel formats that you can download and start using right away to build your own basic SIPOC Diagram. This is a simple SIPOC tool and is one of my most downloaded templates.
I frequently get asked about SIPOC templates in Microsoft Visio. Visio is now included in all of the Microsoft 365 commercial plans, so if you are lucky enough to have access to a Microsoft work account, you will be able to find some process diagram templates in Visio. Specifically there are templates for all the major process methodologies, including Six Sigma. You can see the complete list of Microsoft Visio process templates on the Visio Support Site.
Personally I would not recommend using Microsoft Visio for SIPOC Diagramming. The SIPOC is such an easy, straight-forward Six Sigma diagram tool that Visio is almost overkill for what you need. It would take you more time to format the SIPOC chart in Visio than to just create the appropriate column layout in Microsoft Excel. And if you organization is a Microsoft 365 customer, your Excel-based SIPOC Diagram will integrate nicely with Microsoft Teams and Microsoft SharePoint.
Miro and Mural: Digital Whiteboard Options for SIPOC Templates
If you like digital whiteboard tools, especially if you need remote team collaboration, there are two more great options for creating SIPOC Diagrams that I recommend.
The first one is Miro. Miro does not have a SIPOC template in their library, but the tool is very easy to use and you could be up and running with a simple SIPOC Diagram in no time.
The second option, Mural, has a great SIPOC template you can use, complete with instructions on how to effectively fill it in. Mural has a free, limited account option, so I recommend giving it a try (plus it has a ton of other great template options for all kinds of projects). Below is an image of the SIPOC Diagram template in Mural.

Process Improvement Consulting Services, Including SIPOC Diagram Creation
Or… I can provide the hands-on guidance you need to design and develop one or more SIPOC Diagrams, whether just to better understand or business critical processes or if you are preparing to kickoff a process improvement project. This service includes a brainstorming session to define the business problem or process that needs improvement and ends with a high-level view of a process. Drop me a note and let’s get started!